


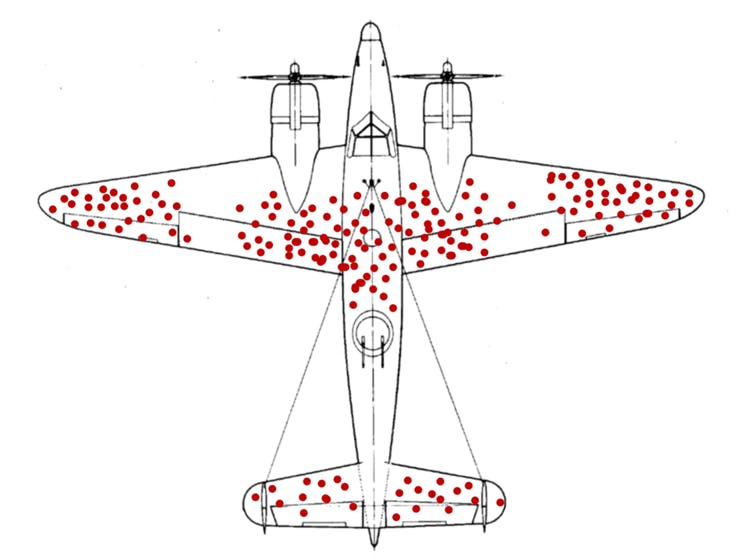
The armor, said Abraham Wald, doesn’t go where the bullet holes are. It goes where the bullet holes aren’t: on the engines. The reason planes were coming back with fewer hits to the engine is that planes that got hit in the engine weren’t coming back.
 There is always code to crack, a trend to understand and a pattern to identify which very often provides extremely useful insights leading to deciding the success of a Military War or Fall of an empire or even which Mutual funds to invest in.
In the field of Data Science and Analytics, Professionals all the time have to analyze data sets and get proper inferences. This helps them decide upon the characteristics of the data. It has always been a very crucial and important part in any project to understand the trends within the data, detect and remove Outliers, check the impact of various variables on other independent variables and on the final model.
One can decide how to manipulate data sources in the best way to discover patterns, spot anomalies, test a hypothesis or cross check an assumption based on insights and inferences derived from the techniques of Exploratory Data Analysis.
The data sets have a lot to reveal if analyzed correctly to find out relationships between attributes.
In a typical project life-cycle upwards of 50% of the time is spent on procuring, cleaning, and exploring the data. Let us have a look at the various tools and techniques used for Exploratory Data Analysis.
For EDA, there are two main methods used by industry professionals to get the desired output.
· Graphical and Non-Graphical.
· Univariate, Bivariate and Multivariate Analysis.
There is always code to crack, a trend to understand and a pattern to identify which very often provides extremely useful insights leading to deciding the success of a Military War or Fall of an empire or even which Mutual funds to invest in.
In the field of Data Science and Analytics, Professionals all the time have to analyze data sets and get proper inferences. This helps them decide upon the characteristics of the data. It has always been a very crucial and important part in any project to understand the trends within the data, detect and remove Outliers, check the impact of various variables on other independent variables and on the final model.
One can decide how to manipulate data sources in the best way to discover patterns, spot anomalies, test a hypothesis or cross check an assumption based on insights and inferences derived from the techniques of Exploratory Data Analysis.
The data sets have a lot to reveal if analyzed correctly to find out relationships between attributes.
In a typical project life-cycle upwards of 50% of the time is spent on procuring, cleaning, and exploring the data. Let us have a look at the various tools and techniques used for Exploratory Data Analysis.
For EDA, there are two main methods used by industry professionals to get the desired output.
· Graphical and Non-Graphical.
· Univariate, Bivariate and Multivariate Analysis.
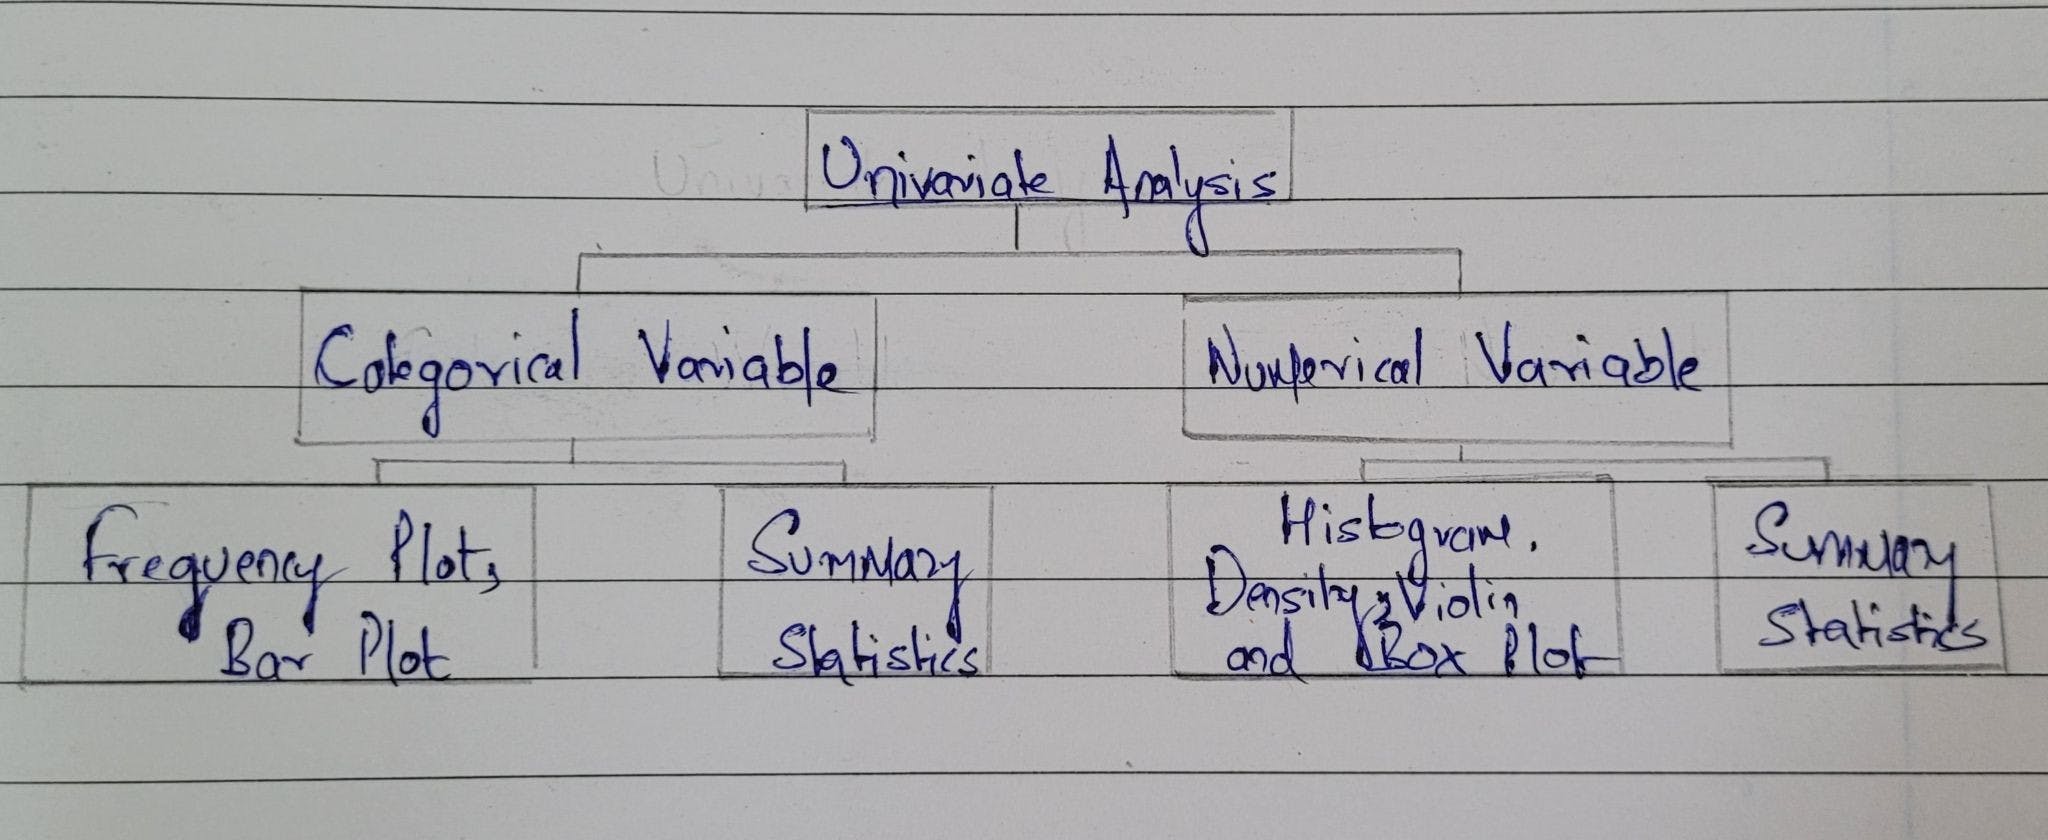
A major part of EDA includes Data Cleaning which is done using functions to check and fill Null values of Variables, checking and removal of Duplicates and special characters in the data, etc. To get a good result and information from the data that can be used to solve industry problems, it is very important to understand the relation between dependent variables and independent variables and the impact it creates on the Business decision to get an informative and useful insight. To understand the relation, codependency of the variable and their impact on the target variable, Exploratory Data Analysis Techniques Univariate Analysis, Bivariate Analysis and Multivariate Analysis is used. Univariate Analysis - It means statistical analysis of one variable in simplest way. The main goal of this analysis is to represent data using numerical and visualization techniques. Plots like Scatter Plot, Line plot, Histogram(summary)plot, box plots, violin plot, etc. are used to do Univariate Analysis.
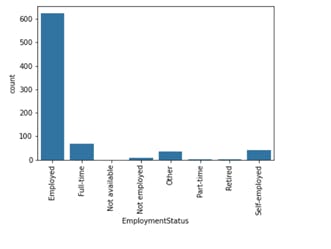
Count plot showing the status of employment in terms of job type
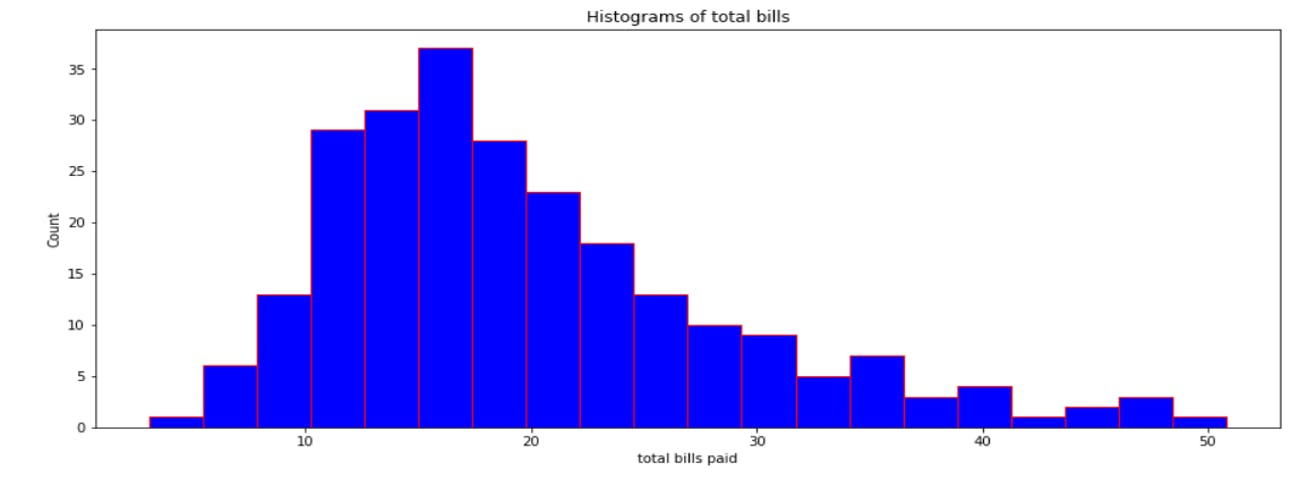
Histogram shows the data about Total bills paid by the customers in a Restaurant
Similarly, Bivariate means statistical analysis of two variables. Since in this type of analysis, considering two variables can be either Categorical or numerical, here are a few plots categorized according to the type of data: Types of Bivariate Analysis Numerical – Numerical
■Line plot ■Scatter plot ■Heat map
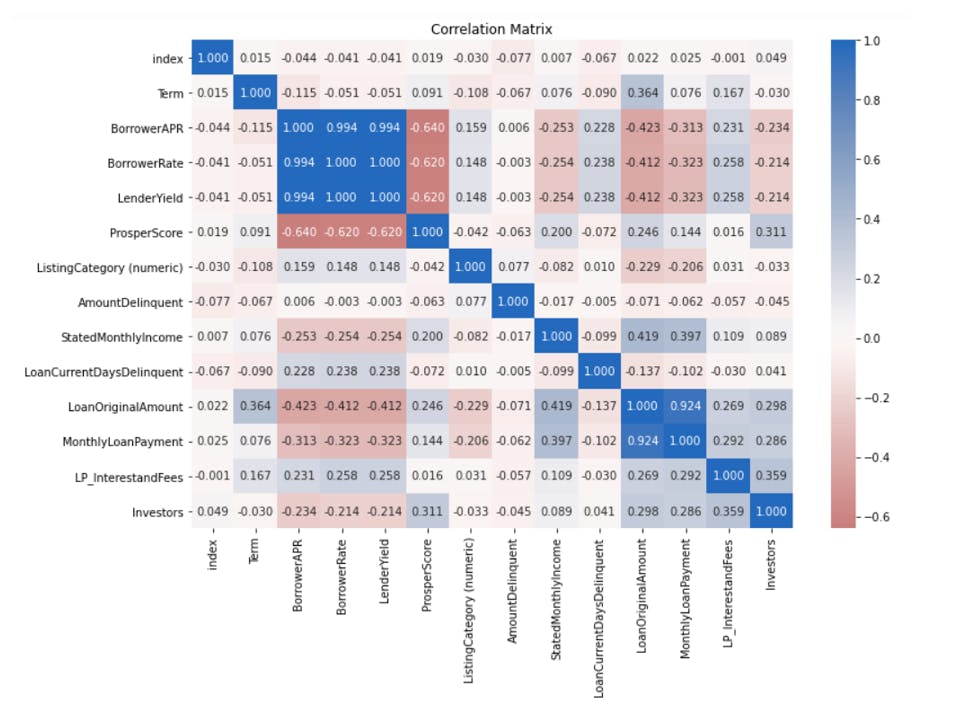
In this Heat Map, the correlation matrix for all numeric variables is shown from Loan Defaulter Dataset.
Numerical – Categorical ■Bar Plot ■Kernel density plot ■Boxplot ■Violin plot ■Stripp lot ■Swarm plot
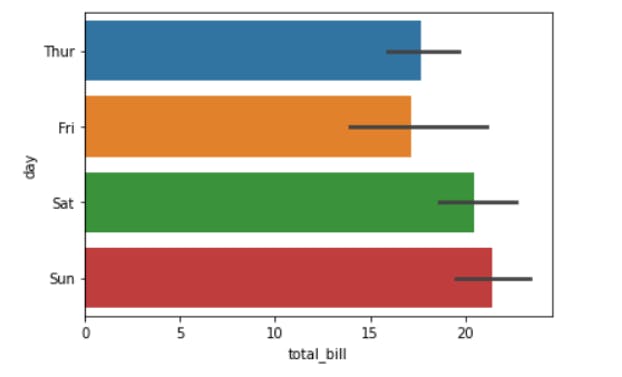
Bar Plot visualizing the amount of Bill (Numerical) received on different days (Categorical).
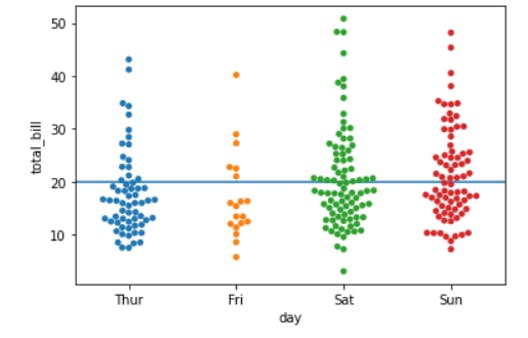
Swarm Plot showing total bills received on different days (Categorical). different days that are more than $20
Categorical –Categorical
■Cross tab ■Stacked Bar Chart ■Count Plot
But what if the data needs to be analyzed for multiple variables? That’s where Multivariate Analysis is used, which is primarily used to determine the relationship between two variables and what effects one variable has on another.
v Categorical –Categorical ■ Cross Tabulation ■ Multiple/ Stacked Bar Plot
v Numerical –Numerical ■ Scatter Plot ■ Heatmap
v Numerical –Categorical ■ Box Plot
Statistical insights play a major role in decision making affecting the Business Objective. There is a special function dedicated to find out the 5 major parameters Mean, Standard Deviation, Median, Max Value, Min Value. Python Code = df.describe() df= Dataframe made using the Pandas library. For making Business decisions through Data, a lot of Preparation of data is required so as to not end up impacting the Business adversely. Measurement Of central Tendencies that includes Mean, Median, Mode and partition values is used for various wrangling and manipulation of data and to impute missing values depending on whether the Variable is creating any effect on the Objective.
♦ Numerical Variables o Impute / Replace Missing Values with Mean o Impute / Replace Missing Values with Median
Both the above techniques that are either replacing the missing values with mean or median are only for Numerical variables however, Data cannot be imputed with mean for highly skewed data, hence for skewed data median only is used.
♦ Categorical Variables o Impute / Replace Missing Values with Mode
Replacing Missing values with mode (most frequent value) is done primarily for categorical columns and also in numerical columns with highly Skewed Data.
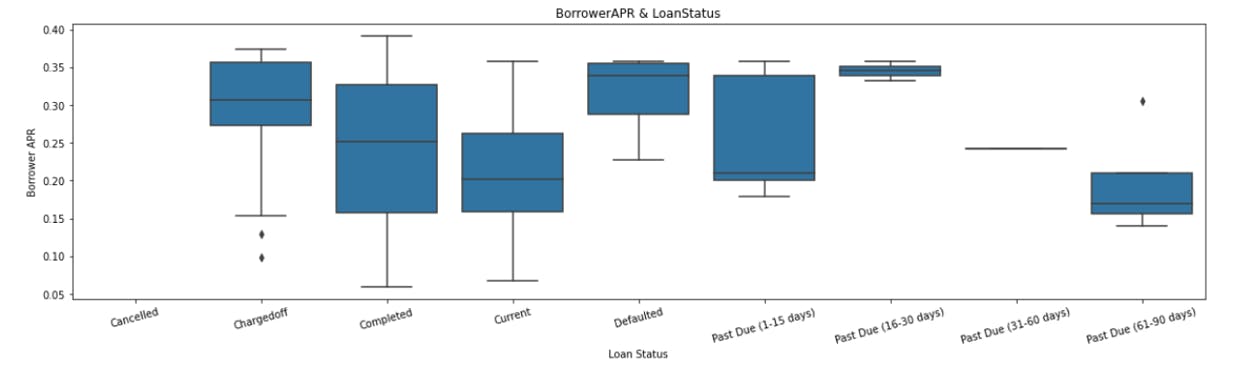
Problem with imputing the data with Central tendencies is that sometimes there are some values that behave differently than other attributes hence resulting in terrible Business decisions. Suppose you are working for an Insurance company and there is a list of eleven Motorbikes out of which there are Ten bikes with engine capacity of 150cc and one Motorbike of 1250 cc of displacement.Now here, the Motorbike with 1250 cc of displacement is an outlier and hence it is better to drop this particular value for the sake of Accuracy.Hence, after the data is cleaned of all the unwanted attributes and is imputed with proper values, the Analysis and Treatment of Outliers is done. Outliers, as the name suggests is a value that behaves differently than other observations, it does not follow the usual pattern and to detect and eliminate Outliers, graphs such as Boxplot are used to detect outliers.
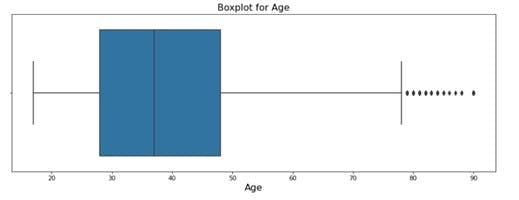
The above plot clearly shows that there are a lot of outliers. Drawing insights, useful information, observing and identifying patterns and making extremely impactful decisions based of them has been in practice of `Mankind since forever, for example Chandler (yes, Chandler from F.R.I.E.N.D.S) was in the field of Statistical Analysis and Data Reconfiguration, which essentially means that he used Statistical Analysis to study Data and make Business Decisions in the 90’s. This unique but totally sensible combination of Statistics and Business has proved to be the most useful and impactful tool there is, to grow Business at a successful scale and EDA plays a major role in it.